Extra Credit Section
This section of the lab is to showcase the value of Nexus Dashboard Insights from a high
level point of view and to provide the basic understanding of NDI.
Cisco Nexus Dashboard functions as a central management console for all the onboarded data center sites
as well as a central hosting platform for data center operation services such as Nexus Dashboard Insights.
It simplifies the operation and life-cycle management of various applications, and reduces the infrastructure
overhead to run those applications by providing a common platform and application infrastructure. Additionally,
it provides a central integration point for API-driven third-party applications with the applications that are
hosted on Nexus Dashboard. For operators to manage, maintain and troubleshoot their networks effectively, it is
important to have a deep understanding of a network’s constituents and their properties, what the network is
doing, how it is being used, how it is responding to the demands on it, and, most importantly, how it will
respond to new loads arising due to new business processes. When changes occur in the control plane, data
plane, and forwarding plane of a network, it is important to detect, locate, and root cause anomalies as
close to real time as possible. Proactive notification of known vulnerabilities that may cause suboptimal
network behavior is very critical. Timely detection and reduction of human errors can help minimize the
operational and financial impact associated with network downtime.
The Operational Intelligence Engine of Cisco Nexus Dashboard Insights incorporates a set of advanced alerting,
baselining, correlation, and forecasting algorithms to provide deep insights into the behavior of the network
by utilizing telemetry data obtained from networking and compute components. Cisco Nexus Dashboard Insights
automates troubleshooting and helps rapid root-causing and early remediation. Unified network repository and
compliance rules keep the network state aligned with operator intent. It simplifies audits and ensures compliance
while also helping infrastructure owners comply with SLA requirements for their users.
The Cisco Nexus Dashboard Insights for the data center is supported for deployments
based on Cisco® Application Centric Infrastructure (Cisco ACI®) and Cisco NX-OS with
Cisco Nexus Dashboard Fabric Controller (NDFC). It is a microservices-based service natively
hosted on Cisco Nexus Dashboard. Nexus Dashboard provides a cluster of compute nodes that are
horizontally scalable. The sizing and number of compute nodes required for Nexus Dashboard Insights
depends on the number of sites, the number of switches in each site, and the flows per second that the
users want the application to support.
Step 1 - Launch Nexus Dashboard Insights
https://10.0.243.73/appcenter/cisco/nexus-insights/ui/
- Username: ciscolive
- Password: C!sco12345
Step 2 -Alert Summary
The first box in Overview is. You can see that Insights gathers aggregrates of
alerts across many fabrics:
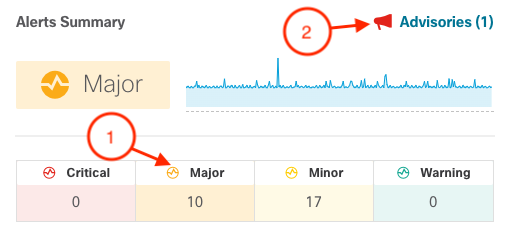
- Click on Major to see faults classified as major from the different fabrics
- Click on Advisories to see how Insights is providing details on End of Life for
hardware that is part of the fabric that is monitored.
-
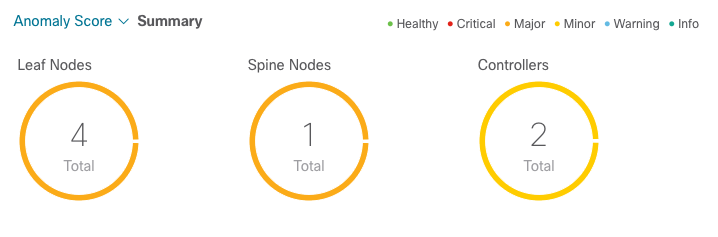
The system also provide anomaly score summaries for each fabric element including
Leafs, Spines and controllers.
-
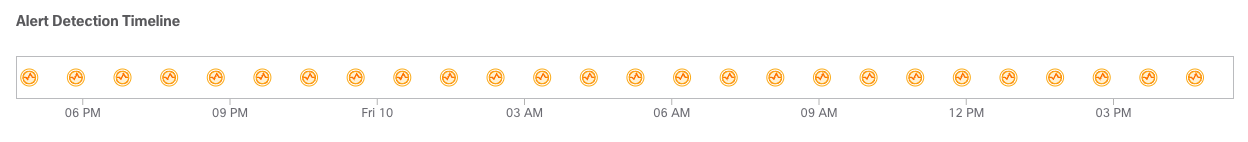
Insights also provides a view based on timeline of events allowing you to
correlate potential known ocurrences of problems at a specific time. You can
click on the different times to see events that happened.
-
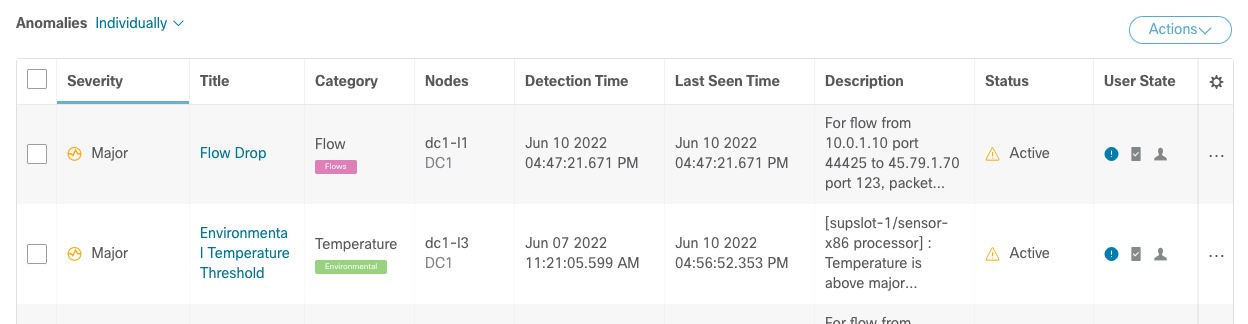
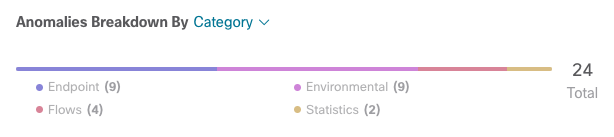
And then you can see anomalies and advisories broken down by category.
-
And finally on the top of the screen you will see in Overview a selection that
says within the last day that you can change to get different window
periods to work with.
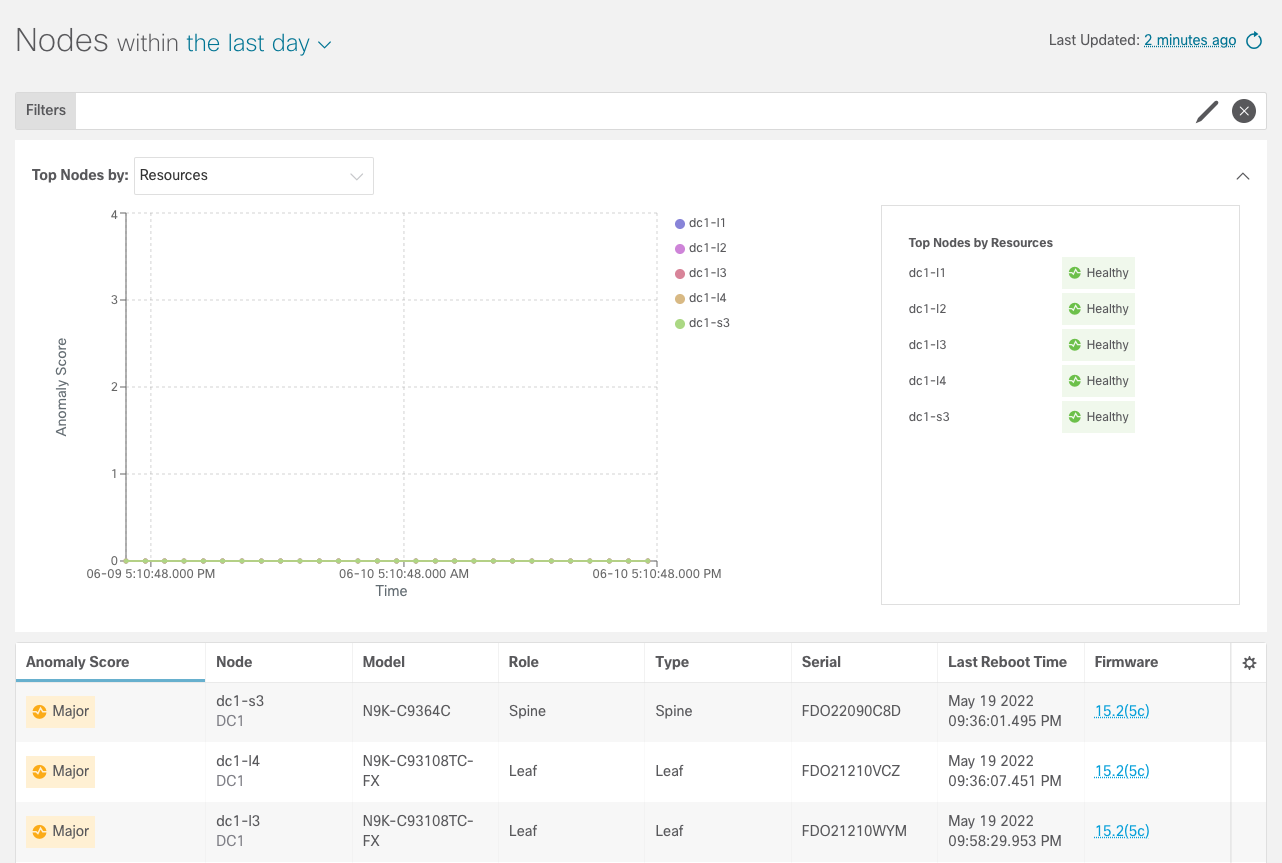
Step 3 - Nodes
On the left side there is the Nodes menu. This will lead you to get per devices
insights.
-
Click on the Nodes menu on the left.
-
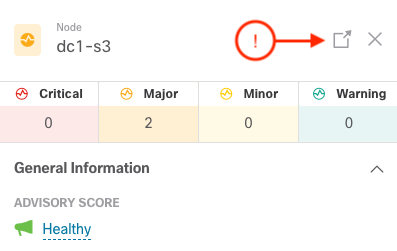
Then click on any of the faults that will bring up a side pane.
-
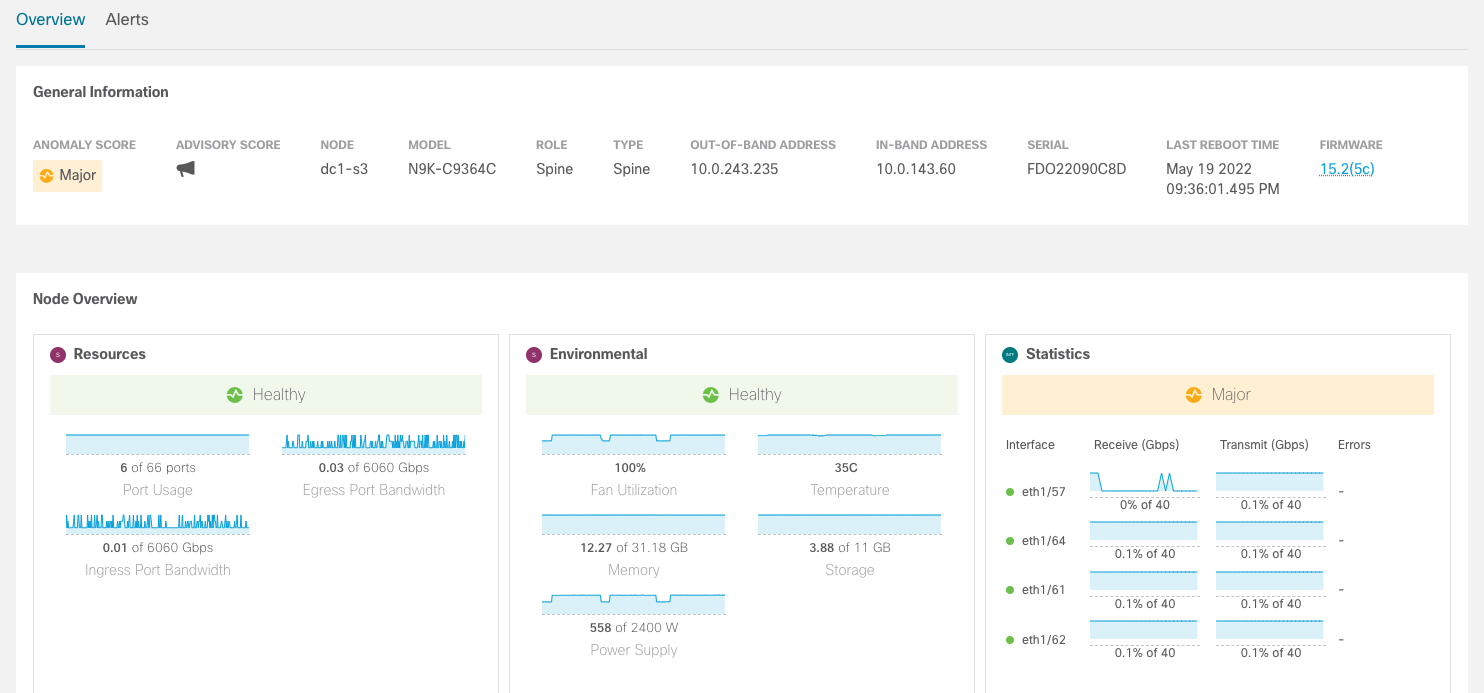
And click on the modal button to expand to a full screen view of this data.
-
Here you can see more information including alerts, resources and
environmental statistics.
Step 4 - Continue exploring Insights
-
Explore: The Explore feature allows you to discover assets and their object associations
in an easy-to-consume natural language query format.
-
Analyze Alerts: Access to total advisories, notices, PSIRTs, displays hardware, software,
and hardening check advisories applicable to your network.
- Anomalies: The Anomalies Dashboard consists of anomalies raised for
resource utilization, environmental issues, interface and routing protocol issues,
flows, endpoints, events, assurance analysis for sites and uploaded files, compliance,
change analysis, and static analysis.
- Advisories: The Advisories Dashboard consists of relevant impact due to field notice, EOL/EOS of software and hardware,
PSIRTs at a node level and compliance.
-
Compliance: Compliance enables you to achieve continuous compliance with security policies and compliance checks.
-
Troubleshoot:The sub-tabs in this area are as follows:
- Delta Analysis: Delta analysis enables you to analyze the difference in the policy,
run time state, and the health of the network between two snapshots.
- Log Collector: Collect and upload the logs for devices in your network to Cisco Intersight Cloud. Enables Cisco TAC to trigger on-demand collection of logs
for user devices on the site and pull the logs from Cisco Intersight Cloud.
-
Browse: The sub-tabs in this area are as follows:
- Resources: This includes monitoring software and hardware resources of site nodes on the
Cisco APIC.
- Environmental: This includes monitoring environmental statistics of hardware resources such as
fan, CPU, memory, and power of the site nodes
- Flows: This feature provides deep insights at a flow level giving details such as average latency,
packet drop indicator and flow move indicator.
- Endpoints: This includes monitoring endpoints on the Cisco site nodes for rapid endpoint moves and endpoints that
do not get learnt back after a reboot across the entire Cisco ACI.
- Interfaces: This includes monitoring of interfaces on the Cisco APIC and site nodes.
- Protocols: This includes monitoring protocols on the Cisco APIC and site nodes.
- Events: This includes monitoring of events, faults and configuration changes.
-
Change Management: The sub-tabs in this area are as follows:
- Firmware Update Analysis: This feature suggests an upgrade path to a recommended software
version and determines the potential impact of the upgrade. It also helps with the
pre-upgrade and post-upgrade validation checks.
- Pre-Change Analysis: This feature allows you to model the intended
changes and verify if the changes generate the desired results.