Browse to APIC
On the laptop you're using, open another tab window and navigate to one of the APIC URLs:
- APIC URL:
https://10.0.226.43

Login to APIC
At the APIC login screen, login using your username and password:
- Username:
acilabpod21
- Password:
cisco.123

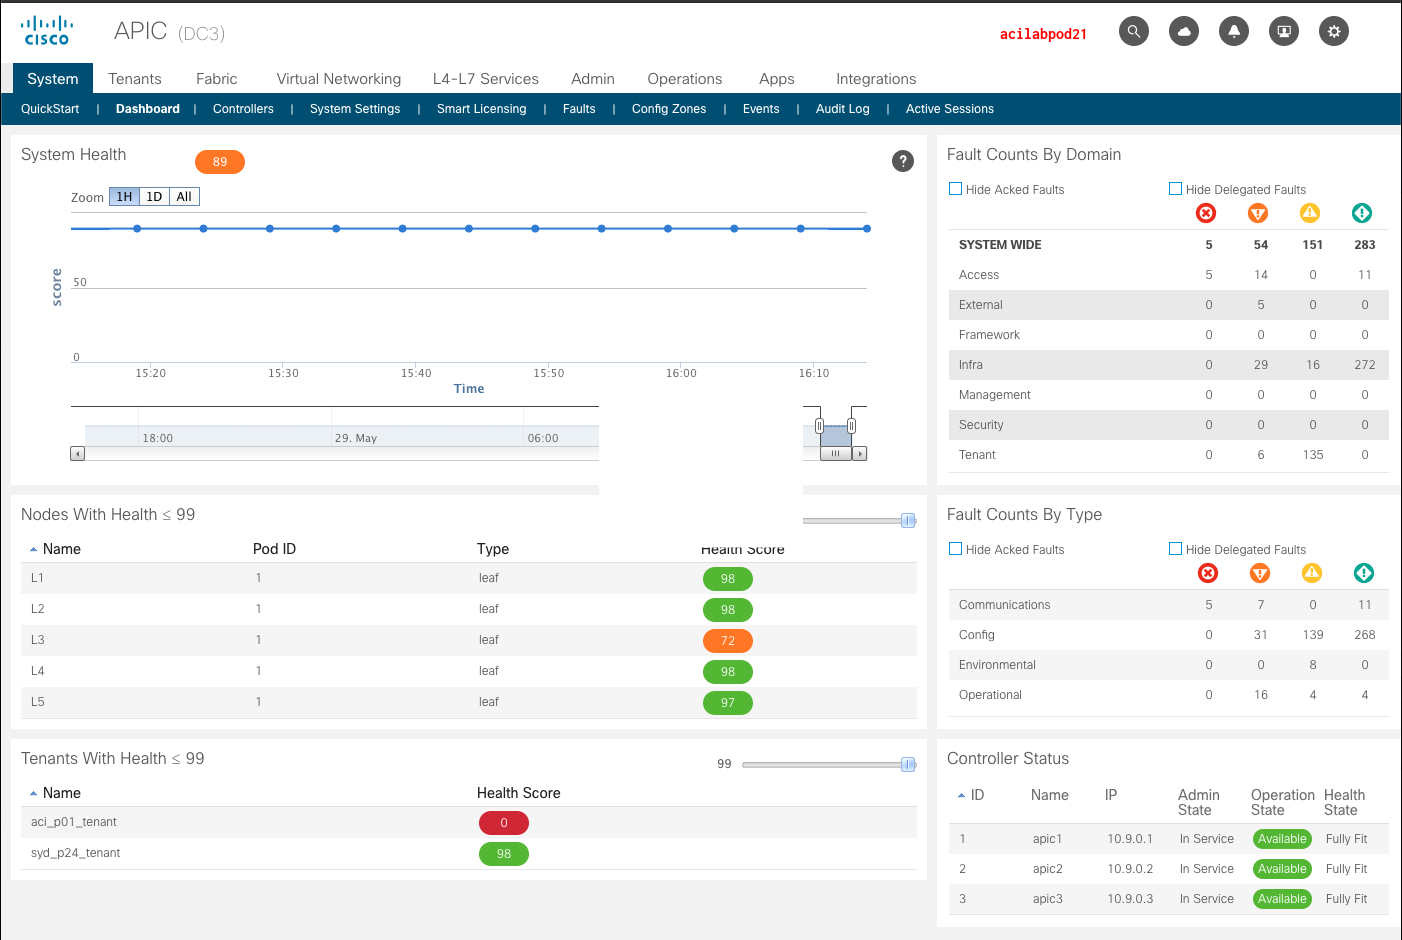
Upon a successful login, you will be at the APIC's ACI fabric dashboard and ready to begin. This
dashboard provides a high level view of the state of the ACI fabric.

For network administrators the first part that is very interesting is the Node Health section.
ACI provides a mechanism to agregrate the state of a leaf or spine into a score. This is called
the health
score and provides the administrator a real easy way to know if something isn't
in a good shape. For example, a spine with 6 power supplies that has 1 power supply failure isn't
going to lower it's health score as much as a leaf switch with two power supplies that looses one.

The same score system is used for the health of a tenant. Here for example if a port in which
a tenant has a virtual machine communicating starts seeing CRC errors, the impact will be reported
with the tenant health and the switch health.
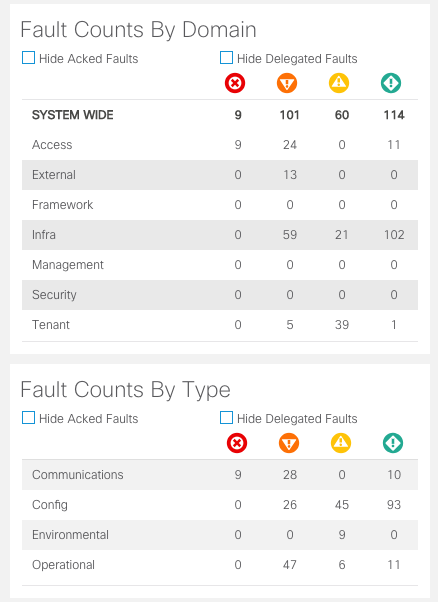
Any situation that would cause the score to lower intiates a fabric fault that are agregrated here
for visiblity to the administrator.


